Package "lattice" is a powerful high-level data visualization system with an emphasis on multivariate data.
It is pre-installed with the R distribution, but not loaded automatically when R starts.
One variable plot functions:
> library(lattice)
> barchart(uptake ~ Plant, CO2)

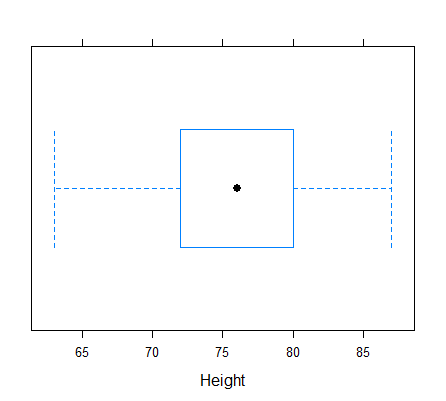
> bwplot(trees$Height, xlab="Height")
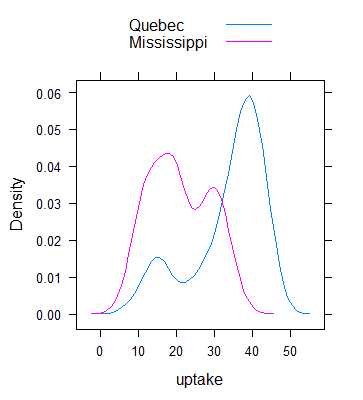
> densityplot(~uptake, CO2, plot.points=FALSE, groups=Type, auto.key=TRUE)
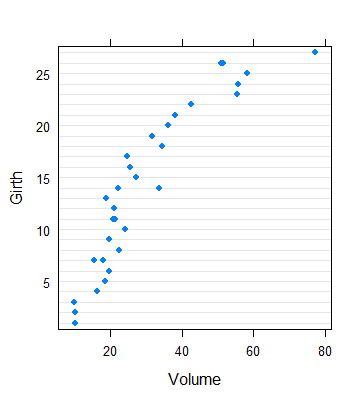
> dotplot(Girth ~ Volume, trees, scales=list(y=list(at=c(5,10,15,20,25))))
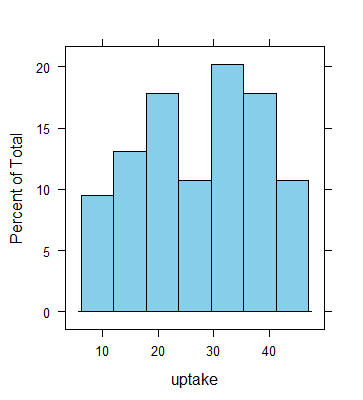
> histogram(~uptake, CO2, col="skyblue")
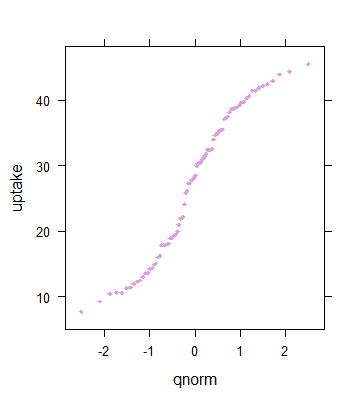
> qqmath(~uptake, CO2, pch=18, cex=.6, col="plum")
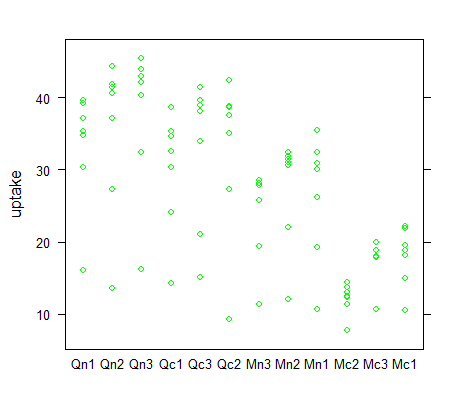
> stripplot(uptake ~ Plant, CO2, col="green")
Two variables plot functions:
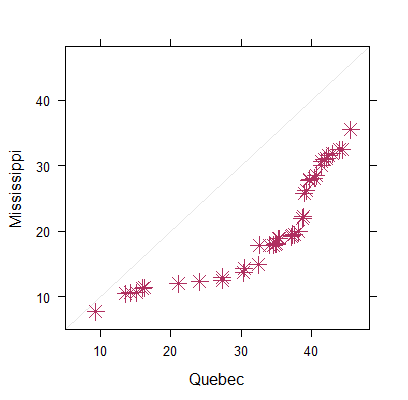
> qq(Type ~ uptake, CO2, cex=1.5, pch=8, col="maroon")
> xyplot(Volume ~ Height, trees, cex=1.5, col="sienna", pch=13)

Three variables plot functions:
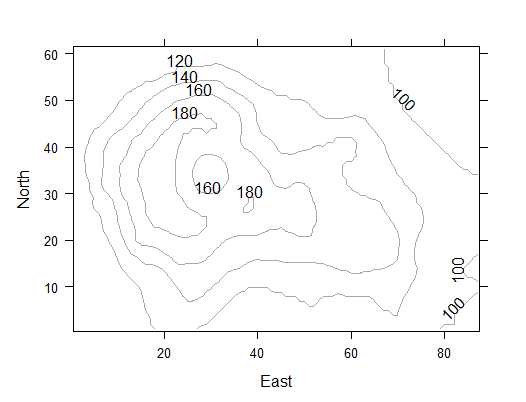
> contourplot(volcano, col="darkgray",xlab="East", ylab="North")
> x <- seq(pi/4, 5 * pi, length.out = 100)
> y <- seq(pi/4, 5 * pi, length.out = 100)
> y <- seq(pi/4, 5 * pi, length.out = 100)
> r <- as.vector(sqrt(outer(x^2, y^2, "+")))
> grid <- expand.grid(x=x, y=y)
> grid$z <- cos(r^2) * exp(-r/(pi^3))
> levelplot(z~x*y, grid)

Other plotting functions:
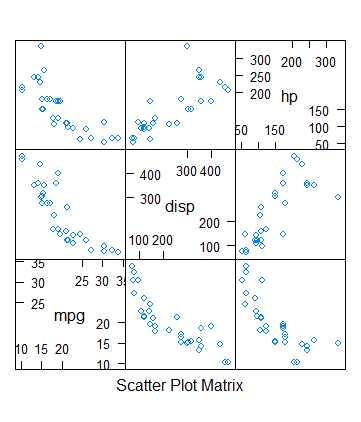
> splom(mtcars[c(1,3,4)])
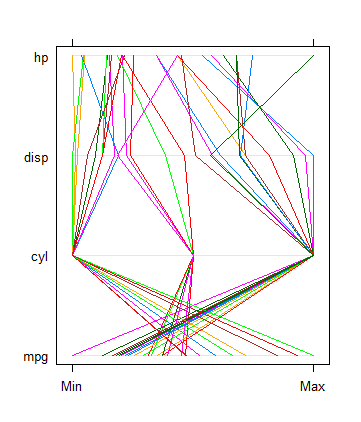
> parallelplot(~mtcars[1:4], mtcars)
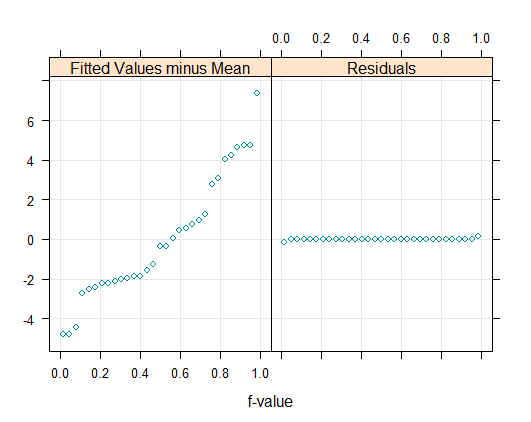
> rfs(oneway(Girth ~ Volume, data=trees), col="darkcyan")
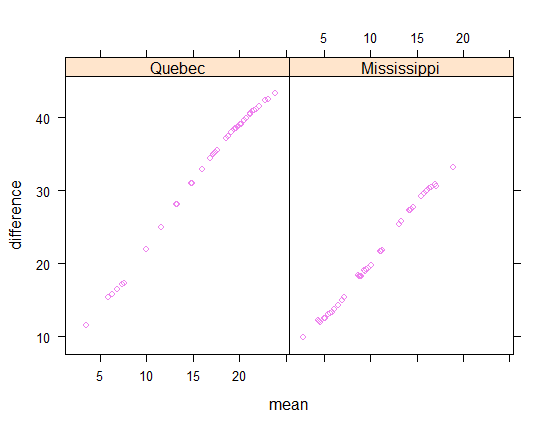
> tmd(qqmath(~uptake | Type, CO2), col="violet")
