Time Series is a data type that all data points are associated with a time stamp. Time Series data are frequently
used in some fields such as finance.
ts() function can be used to create a Time Series object.
ts(data=NA, start=1, end=numeric(), frequency=1, deltat=1, ts.eps=getOption("ts.eps"), class=, names=)
data: a numeric vector or matrix of the observed time-series values. A data frame will be coerced to a numeric matrix via data.matrix.
start: the time of the first observation. Either a single number or a vector of two integers, which specify a natural time unit and a (1-based) number of samples into the time unit. See the examples for the use of the second form.
end: the time of the last observation, specified in the same way as start.
frequency: the number of observations per unit of time.
deltat: the fraction of the sampling period between successive observations; e.g., 1/12 for monthly data. Only one of frequency or deltat should be provided.
ts.eps: time series comparison tolerance. Frequencies are considered equal if their absolute difference is less than ts.eps.
class: class to be given to the result, or none if NULL or "none". The default is "ts" for a single series, c("mts", "ts", "matrix") for multiple series.
names: a character vector of names for the series in a multiple series: defaults to the colnames of data, or Series 1, Series 2, ....
There are several builtin time series datasets.
> sunspots
> options(digits=2)
> t <- ts(rnorm(20,mean=2), frequency = 4, start = c(2014, 1))
> t
     Qtr1 Qtr2 Qtr3 Qtr4
2014 4.61 1.45 1.98 3.36
2015 2.05 2.21 0.11 0.85
2016 1.85 0.99 2.17 2.21
2017 1.55 2.34 1.68 2.67
2018 1.82 1.35 3.24 0.51
> ts(rnorm(36,mean=2), frequency = 12, start = c(2014, 1))
      Jan  Feb  Mar  Apr  May  Jun  Jul  Aug  Sep  Oct  Nov  Dec
2014 0.48 1.23 3.59 0.22 1.55 2.09 1.56 0.92 2.56 1.67 1.46 1.12
2015 3.56 1.44 2.83 2.09 2.23 3.94 1.51 1.63 2.17 2.53 2.72 2.11
2016 0.58 1.24 2.37 2.85 1.77 1.86 1.70 1.63 2.47 1.52 2.20 1.81
> is.ts(t)
[1] TRUE
> x <- c(3.8, 2.4, 1.7, 2.4)
> as.ts(x)
Time Series:
Start = 1
End = 4
Frequency = 1
[1] 3.8 2.4 1.7 2.4
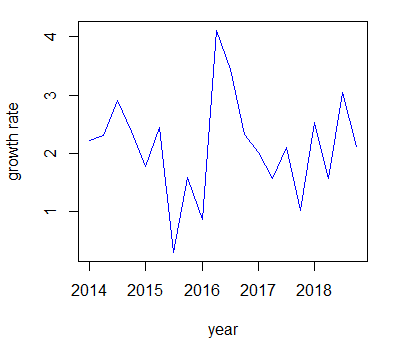
plot.ts() can be used to plot ts datasets.
> plot.ts(t,typ="l",col="blue",xlab="year",ylab="growth rate")