polygon(x, y = NULL, density = NULL, angle = 45,
border = NULL, col = NA, lty = par("lty"), ..., fillOddEven = FALSE)
x, y: vectors containing the coordinates of the vertices of the polygon.
density: the density of shading lines, in lines per inch. The default value of NULL means that no shading lines are drawn. A zero value of density means no shading nor filling whereas negative values and NA suppress shading (and so allow color filling).
angle: the slope of shading lines, given as an angle in degrees (counter-clockwise).
col: color of the plot, see color's chart.
border: the color to draw the border. The default, NULL, equals par("fg"). border=NA omits borders.
lty: the line type to be used.
...: other graphical parameters.
fillOddEven: logical controlling the polygon shading mode.
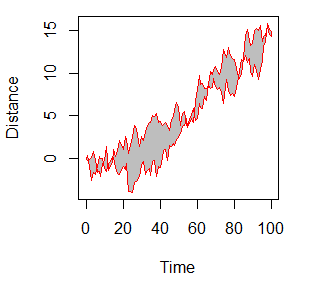
> n <- 100
> xx <- c(0:n, n:0)
> yy <- c(c(0, cumsum(stats::rnorm(n))), rev(c(0, cumsum(stats::rnorm(n)))))
> plot   (xx, yy, type = "n", xlab = "Time", ylab = "Distance")
> polygon(xx, yy, col = "gray", border = "red")
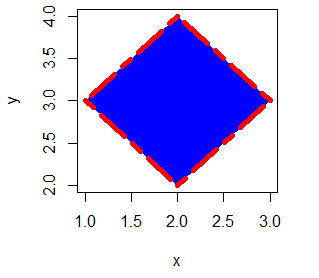
> x <- c(1,2,3,2,1)
> y <- c(3,2,3,4,3)
> plot(x,y,type="n")
> polygon(x,y,col="blue",border="red",lwd="5",lty=6)