Package ggplot2 is a unique system which has many plotting functions. It uses
> install.packages("ggplot2",repos="http://cran.r-project.org",dep=TRUE)
> library(ggplot2)
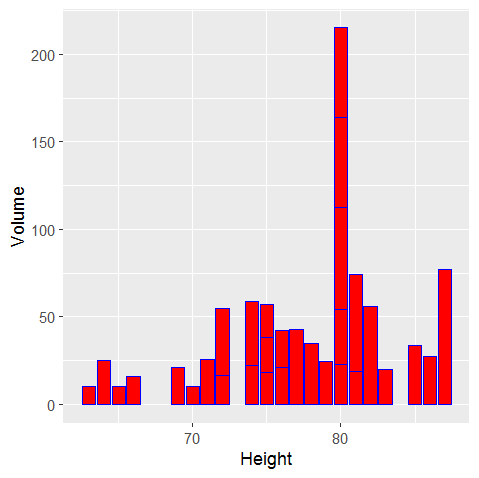
> gg <- ggplot(trees, aes(y=Volume, x=Height)) #trees is a builtin dataset
> gg + geom_bar(stat="identity",color="blue",fill="red")
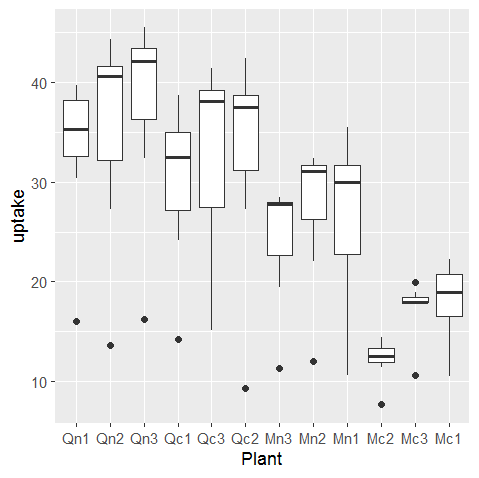
> gg <- ggplot(CO2, aes(Plant,uptake))#CO2 is a builtin dataset
> gg + geom_boxplot()
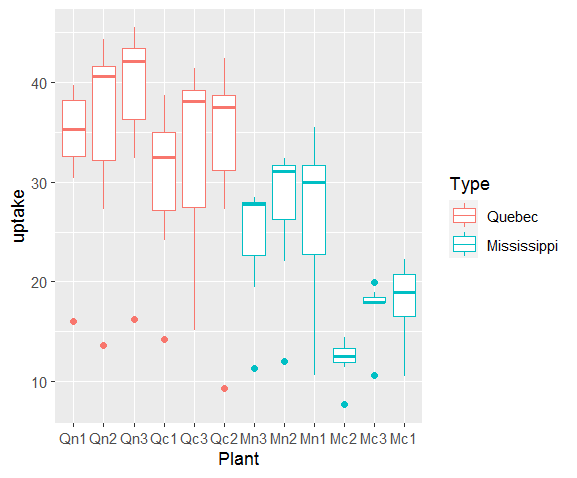
> gg + geom_boxplot(aes(color=Type))
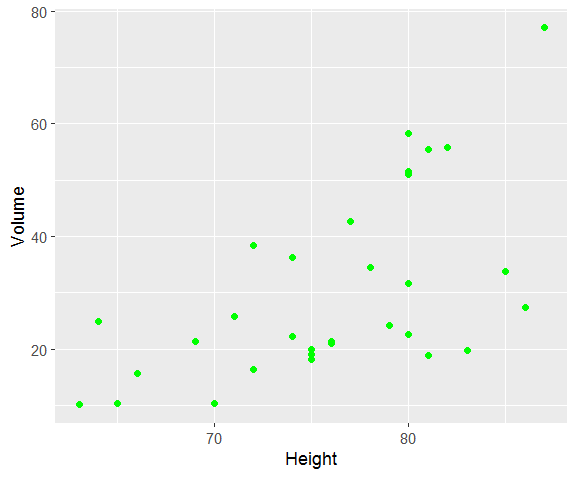
> gg <- ggplot(trees, aes(Height,Volume))
> gg + geom_point(color="green")
> gg <- ggplot(CO2,aes(uptake))
> gg + geom_histogram(bins=20,color="green",fill="yellow")
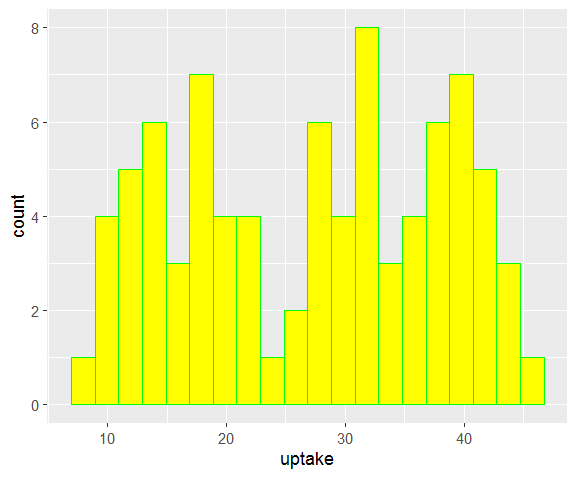
It can also plot time series data. Following code downloads the stock trading data and plots it:
> install.packages("tseries",repos="http://cran.r-project.org",dep=TRUE)
> library(tseries)
> rcl <- get.hist.quote("rcl")  #stocks data of Royal Caribbean Ltd.
time series starts 1993-04-28
time series ends   2020-03-27
> head(rcl)
             Open   High    Low  Close
1993-04-28 9.1250 9.3750 9.0000 9.1250
1993-04-29 9.1250 9.3125 9.1250 9.3125
1993-04-30 9.3750 9.3750 9.1250 9.1875
1993-05-03 9.1250 9.1875 9.0625 9.1875
1993-05-04 9.1875 9.1875 8.9375 9.0625
1993-05-05 9.0000 9.0625 8.8750 8.8750
>autoplot(rcl)
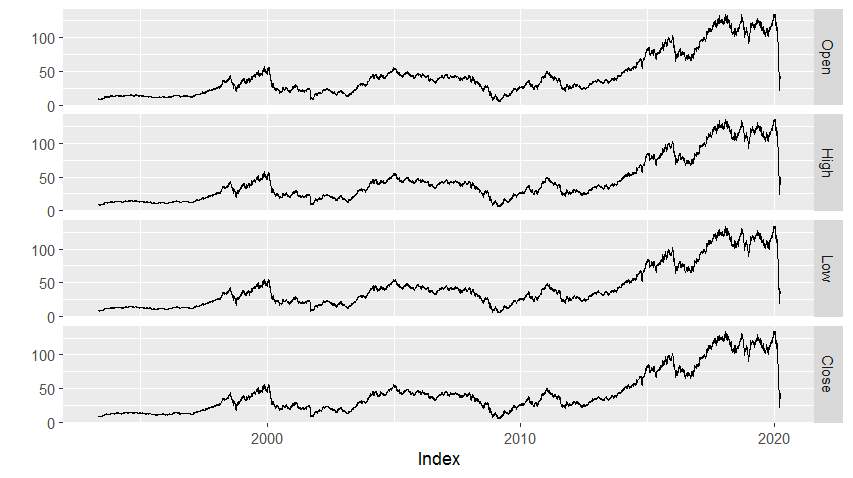
Following is the complete data of the stock RCL:
Plotting functions list of package "ggplot2":