complex(length.out = 0, real = numeric(), imaginary = numeric(),
modulus = 1, argument = 0)
as.complex(x, ...)
is.complex(x)
Re(z)
Im(z)
Mod(z)
Arg(z)
Conj(z)
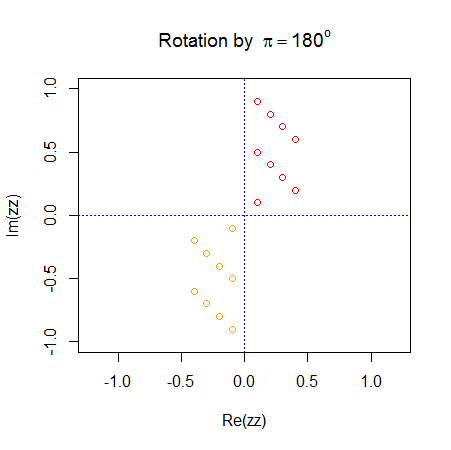
> require(graphics) > 0i ^ (-3:3)[1] Inf+0i Inf+0i Inf+0i 1+0i 0+0i 0+0i 0+0i > matrix(1i^ (-6:5), nrow=4)#- all columns are the same [,1] [,2] [,3] [1,] -1+0i -1+0i -1+0i [2,] 0-1i 0-1i 0-1i [3,] 1+0i 1+0i 1+0i [4,] 0+1i 0+1i 0+1i > 0 ^ 1i# a complex NaN [1] NaN+NaNi ## create a complex normal vector > z <- complex(real = stats::rnorm(100), imaginary = stats::rnorm(100))## or also (less efficiently): > z[1] 0.4058760+0.9050012i -0.8377527-0.2545470i [3] -1.5847845+3.0573032i -0.7793139-1.5311944i [5] 0.0620261+0.9123234i 2.1555988-0.7908964i ...... > z2 <- 1:2 + 1i*(8:9)## The Arg(.) is an angle: [1] 1+8i 2+9i > zz <- (rep(1:4,len=9) + 1i*(9:1))/10 > zz[1] 0.1+0.9i 0.2+0.8i 0.3+0.7i 0.4+0.6i [5] 0.1+0.5i 0.2+0.4i 0.3+0.3i 0.4+0.2i [9] 0.1+0.1i > zz.shift <- complex(modulus = Mod(zz), argument= Arg(zz) + pi) > zz.shift[1] -0.1-0.9i -0.2-0.8i -0.3-0.7i [4] -0.4-0.6i -0.1-0.5i -0.2-0.4i [7] -0.3-0.3i -0.4-0.2i -0.1-0.1i > plot(zz, xlim=c(-1,1), ylim=c(-1,1), col="red", asp = 1, main = expression(paste("Rotation by "," ", pi == 180^o))) > abline(h=0,v=0, col="blue", lty=3) > points(zz.shift, col="orange")
