aes(x, y, ...)
x, y, ...: List of name-value pairs in the form aesthetic = variable describing which
variables in the layer data should be mapped to which aesthetics used by the
paired geom/stat. The names for x and y can be omitted; all other aesthetics must be
named.
> install.packages("ggplot2",repos="http://cran.r-project.org",dep=TRUE)
> library(ggplot2)
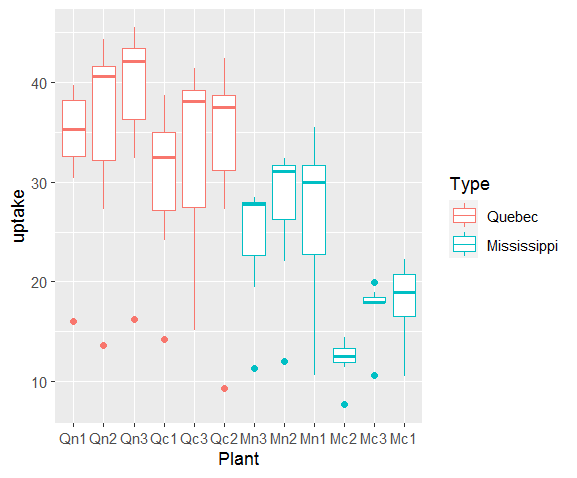
> gg <- ggplot(CO2, aes(Plant,uptake)) #CO2 is a builtin dataset
> gg + geom_boxplot(aes(color=Type))