sin(x)
x: Numeric value, array or vector
> sin(pi)[1] 1.224606e-16 > sin(-pi)[1] -1.224606e-16 > sin(pi/3)[1] 0.8660254 > sin(pi/2)[1] 1
Use vector as the argument:
> sin(c(3.2, 1, 0, 12));[1] -0.05837414 0.84147098 0.00000000 -0.53657292 > x <- c(1.5 * pi, 2 * pi, pi/4, pi/6) > sin(x)[1] -1.000000e+00 -2.449213e-16 7.071068e-01 5.000000e-01
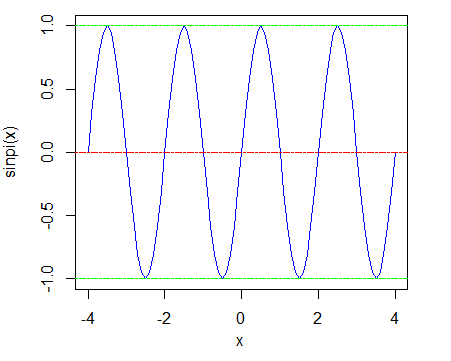
Let's plot the function:
> x <- seq(-2 * pi, 2 * pi, by=0.1)
> plot(x, sin(x), typ="l", col="blue")
> abline(h=0,col="green",lty=6)

It's a little bit strange that sin(pi) = 1.224606e-16 ( ≈ 0 ).
However,
> sinpi(1)[1] 0 > sinpi(0.5)[1] 1 > sinpi(0)[1] 0 > sinpi(1/3)[1] 0.8660254 > sinpi(1/4)[1] 0.7071068
