image(x, y, z, zlim, xlim, ylim, col = heat.colors(12),
add = FALSE, xaxs = "i", yaxs = "i", xlab, ylab,
breaks, oldstyle = FALSE, useRaster, ...)
x, y: locations of grid lines at which the values in z are measured. These must be finite, non-missing and in (strictly) ascending order. By default, equally spaced values from 0 to 1 are used. If x is a list, its components x$x and x$y are used for x and y, respectively. If the list has component z this is used for z.
z: a matrix containing the values to be plotted (NAs are allowed). Note that x can be used instead of z for convenience.
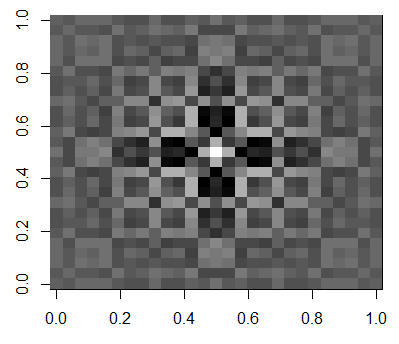
> x <- y <- seq(-4*pi, 4*pi, len = 27)
> r <- sqrt(outer(x^2, y^2, "+"))
> image(z = z <- cos(r^2)*exp(-r/6), col  = gray((0:32)/32))
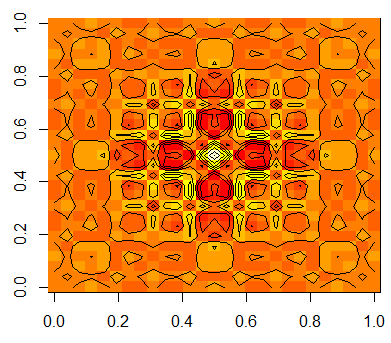
> image(z = z <- cos(r^2)*exp(-r/6))
> contour(z, add = TRUE, drawlabels = FALSE)
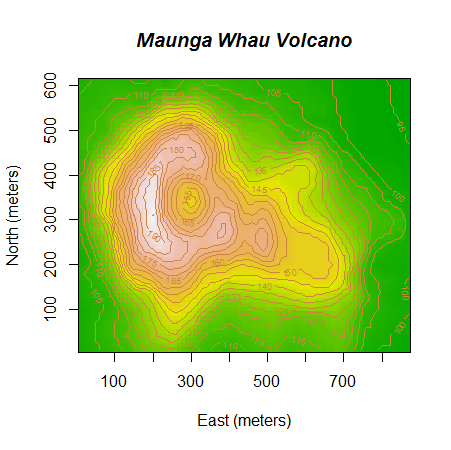
Display of the dataset volcano:
> x <- 10*(1:nrow(volcano))
> y <- 10*(1:ncol(volcano))
> image(x, y, volcano, col = terrain.colors(100), axes = FALSE, xlab="East (meters)", ylab="North (meters)")
> contour(x, y, volcano, levels = seq(90, 200, by = 5),
+         add = TRUE, col = "peru")
> axis(1, at = seq(100, 800, by = 100))
> axis(2, at = seq(100, 600, by = 100))
> box()
> title(main = "Maunga Whau Volcano", font.main = 4)