curve(expr, from = NULL, to = NULL, n = 101, add = FALSE,
type = "l", xname = "x", xlab = xname, ylab = NULL,
log = NULL, xlim = NULL, ...)
expr: the name of a function, or a call or an expression written as a function of x which will evaluate to an object of the same length as x
n: integer; the number of x values at which to evaluate
add: logical; if TRUE add to an already existing plot; if NA start a new plot taking the defaults for the limits and log-scaling of the x-axis from the previous plot. Taken as FALSE (with a warning if a different value is supplied) if no graphics device is open
For more parameters, see plot.
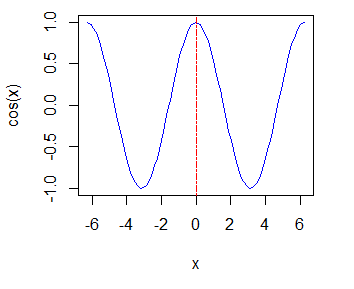
> curve(cos, -2 * pi, 2 * pi, col="blue")
> abline(v=0, col="red", lty=6)

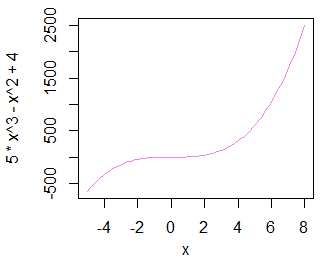
> curve(5 * x ^ 3 - x ^ 2 + 4, -5, 8, col="violet")

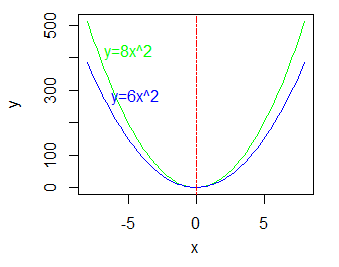
Let's draw two functions together:
> fun <- function(x) {8 * x ^ 2}
> curve(fun, -8, 8, col="green", ylab="y")
> curve(6 * x ^ 2 , -8, 8, col="blue", add=T)
> abline(v=0, col="red", lty=6)
> text(-5,420,"y=8x^2",col="green")
> text(-4.5,280,"y=6x^2",col="blue")
