segments(x0, y0, x1 = x0, y1 = y0,
col = par("fg"), lty = par("lty"), lwd = par("lwd"), ...)
x0, y0, x1, y1: coordinates of points from and points to.
col, lty, lwd, ...: other graphical parameters.
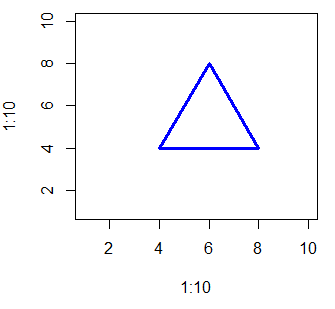
Let's draw a triangle:
> plot(1:10,1:10,typ="n");
> segments(4,4,8,4,col="blue",lwd=3)
> segments(8,4,6,8,col="blue",lwd=3)
> segments(6,8,4,4,col="blue",lwd=3)