density(x, bw = "nrd0", adjust = 1,
kernel = c("gaussian", "epanechnikov", "rectangular",
"triangular", "biweight",
"cosine", "optcosine"),
weights = NULL, window = kernel, width,
give.Rkern = FALSE,
n = 512, from, to, cut = 3, na.rm = FALSE, ...)
Let generate 100 numbers randomly:
>x <- stats::rnorm(100)
>x
[1] -0.154103462 0.271704132 -0.234160855 0.764474679 0.438237645
[6] -0.763854668 1.303402711 0.051660328 1.064258570 0.079144697
[11] -0.704381407 2.239763673 -0.749203152 0.601148921 -0.174814689
[16] 0.100238929 0.670921777 -0.351881772 -1.452691553 0.774250401
[21] 0.985238459 -0.159947063 0.456925349 0.062732203 -0.139094156
[26] -0.021987877 -0.369758710 -0.623015605 0.818971164 1.024360342
[31] -1.180039385 -1.126115746 -1.331609773 0.261068252 0.306040509
[36] 0.186887898 0.039764640 0.618133561 0.808466877 1.530479825
[41] -0.326594787 -0.525549355 -0.038649831 -0.320394434 -0.116615568
[46] -0.928403864 1.284014444 0.559523194 0.511753047 -0.093609863
[51] -1.199423552 -0.358438485 -1.421215594 -0.199430722 -1.285244671
[56] -0.344308069 0.202383513 -1.044830704 0.009940864 -1.083693166
[61] 0.985718206 0.942167477 0.077569581 1.456191918 -1.385394960
[66] -0.174887806 -0.869293103 1.051227075 -0.726361522 0.082628666
[71] 1.275779587 0.258221666 -0.629207453 -0.589352154 -0.818233970
[76] 0.028423636 -0.491220068 0.796916741 -1.407925480 0.765093431
[81] -0.263630781 0.854937357 0.592710059 -0.095388956 -1.064601796
[86] 0.691149856 0.822038961 0.666786287 -1.062610036 -2.833961199
[91] 1.570993774 -0.876630726 -0.343492831 -0.480549452 1.494723381
[96] -2.025528709 0.949853574 -0.917568904 -1.103676434 0.728284402
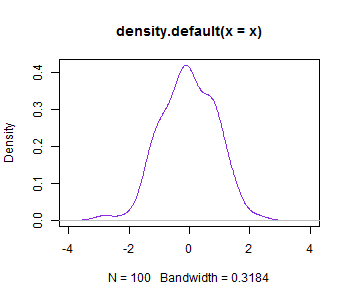
>d <- density(x)
>d
Call:
density.default(x = x)
Data: x (100 obs.); Bandwidth 'bw' = 0.3184
x y
Min. :-3.7891 Min. :0.0001413
1st Qu.:-2.0431 1st Qu.:0.0117442
Median :-0.2971 Median :0.0627054
Mean :-0.2971 Mean :0.1430424
3rd Qu.: 1.4489 3rd Qu.:0.2957362
Max. : 3.1949 Max. :0.4192181
Plot the density:
>plot(density(x),xlim=c(-4,4),col="blueviolet")