axis(side, at = NULL, labels = TRUE, tick = TRUE, line = NA,
pos = NA, outer = FALSE, font = NA, lty = "solid",
lwd = 1, lwd.ticks = lwd, col = NULL, col.ticks = NULL,
hadj = NA, padj = NA, gap.axis = NA, ...)
side: an integer specifying which side of the plot the axis is to be drawn on. The axis is placed as follows: 1=below, 2=left, 3=above and 4=right.
at: the points at which tick-marks are to be drawn. Non-finite (infinite, NaN or NA) values are omitted. By default (when NULL) tickmark locations are computed, see ‘Details’ below.
labels: this can either be a logical value specifying whether (numerical) annotations are to be made at the tickmarks, or a character or expression vector of labels to be placed at the tickpoints. (Other objects are coerced by as.graphicsAnnot.) If this is not logical, at should also be supplied and of the same length. If labels is of length zero after coercion, it has the same effect as supplying TRUE.
tick: a logical value specifying whether tickmarks and an axis line should be drawn.
line: the number of lines into the margin at which the axis line will be drawn, if not NA.
pos: the coordinate at which the axis line is to be drawn: if not NA this overrides the value of line.
outer: a logical value indicating whether the axis should be drawn in the outer plot margin, rather than the standard plot margin.
font: font for text. Defaults to par("font").
lty: line type for both the axis line and the tick marks.
lwd, lwd.ticks: line widths for the axis line and the tick marks. Zero or negative values will suppress the line or ticks.
col, col.ticks: colors for the axis line and the tick marks respectively. col = NULL means to use par("fg"), possibly specified inline, and col.ticks = NULL means to use whatever color col resolved to.
hadj: adjustment (see par("adj")) for all labels parallel (‘horizontal’) to the reading direction. If this is not a finite value, the default is used (centring for strings parallel to the axis, justification of the end nearest the axis otherwise).
padj: adjustment for each tick label perpendicular to the reading direction. For labels parallel to the axes, padj = 0 means right or top alignment, and padj = 1 means left or bottom alignment. This can be a vector given a value for each string, and will be recycled as necessary.
If padj is not a finite value (the default), the value of par("las") determines the adjustment. For strings plotted perpendicular to the axis the default is to centre the string.
gap.axis: an optional (typically non-negative) numeric factor to be multiplied with the size of an ‘m’ to determine the minimal gap between labels that are drawn.
...: other graphical parameters.
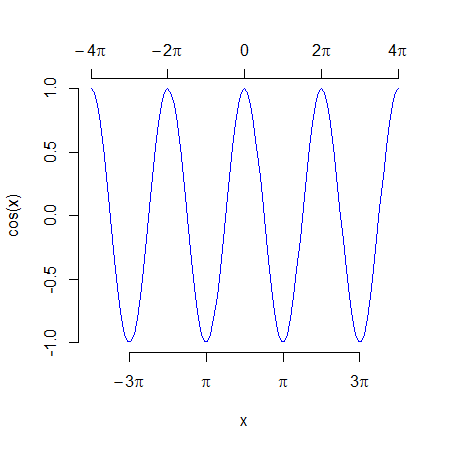
> curve(cospi, -4, 4, col="blue", axes=F, ylab="cos(x)")
> axis(1, at=c(-3,-1,1,3), labels=expression(-3 * pi, pi, pi, 3 * pi))
> axis(3, at=c(-4,-2,0, 2, 4),  labels=expression(-4 * pi, -2 * pi,0, 2 * pi, 4 * pi))
> axis(2, at=c(-1,-0.5,0, 0.5, 1))